Printer Usage Report -- Printer Usage Reporting Tool       print manager video


Printer Usage Report is a printer usage reporting tool, and it doesn't capture and save the print jobs into the database. If you have your print management software and want to use Printer Usage Report to generate and view 100 reports, please make your print job database (either MS Access or SQL) meet the minimum requirements that the sample database 'printSaver_sample.mdb' provides C:\Program Files (x86)\PrintLimit\Printer Usage Report\printSaver_sample.mdb). Our print management software PrintLimit Print Tracking and PrintLimit Print Release Station can track, manage and control the print/copy jobs and save the data into the database that is compatible with Printer Usage Report.

If Printer Usage Report and Print Management Software (PrintLimit Print Tracking, Coper Tracking System, or PrintLimit Print Release Station) are installed on the same computer, the default database file 'printSaver.mdb' is located in the installation folder of Print Management Software (e.g., C:\Program Files (x86)\PrintLimit\PrintLimit Print Tracking). If you install Printer Usage Report and Print Management Software on different computers, you can share the database folder from the computer where Print Management Software is installed, Printer Usage Report can connect to the shared database remotely (on the second computer) to view reports (e.g., \\PrintLimit Print Tracking Computer Name\Shared Database Folder\printSaver.mdb). If you are using SQL server, you can use Printer Usage Report to connect to the SQL database from any computer to view the reports.

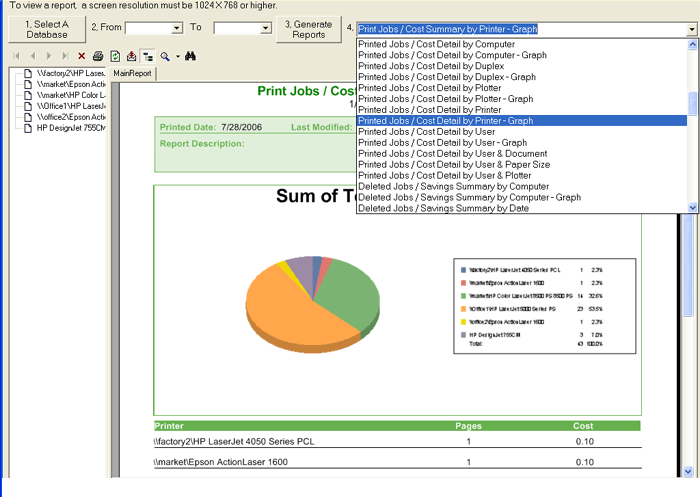
Select the Database

Click the button to select a database (either MS Access database or SQL database) to connect. If you install PrintLimit Print Tracking (or Coper Tracking System or Print Release Station), you can share the database folder from the computer where Print Management Software is installed, Printer Usage Report can connect to the shared database remotely (on the second computer) to view reports. (e.g., \\PrintLimit Print Tracking Computer Name\Shared Database Folder\printSaver.mdb. If you are using SQL server, then you can use Printer Usage Report to connect to the SQL database from any computer to view the reports.

Define a Time Frame

The default is from the first day of the month to today's date.

Generate Reports

Generate Reports at the defined time frame.

View a Report

Select a Report to view.

printer usage

There are 100 Reports including 64 default reports and 36 customized reports for your cost analysis:

Report #     Report Name

  1. Printed Jobs/Cost Top Five by Computer
  2. Printed Jobs/Cost Top Five by Group
  3. Printed Jobs/Cost Top Five by Printer
  4. Printed Jobs/Cost Top Five by User
  5. Printed Jobs/Cost Summary by Client
  6. Printed Jobs/Cost Summary by Client - Graph
  7. Printed Jobs/Cost Summary by Computer
  8. Printed Jobs/Cost Summary by Computer - Graph
  9. Printed Jobs/Cost Summary by Date
  10. Printed Jobs/Cost Summary by Date - Graph
  11. Printed Jobs/Cost Summary (Plotter) by Date
  12. Printed Jobs/Cost Summary (Plotter) by Date - Graph
  13. Printed Jobs/Cost Summary by Group
  14. Printed Jobs/Cost Summary by Group - Graph
  15. Printed Jobs/Cost Summary by Group & User
  16. Printed Jobs/Cost Summary by Plotter
  17. Printed Jobs/Cost Summary by Plotter - Graph
  18. Printed Jobs/Cost Summary by Printer
  19. Printed Jobs/Cost Summary by Printer - Graph
  20. Printed Jobs/Cost Summary by User
  21. Printed Jobs/Cost Summary by User & Color
  22. Printed Jobs/Cost Summary by User & Printer
  23. Printed Jobs/Cost Summary by User & Printer & Color
  24. Printed Jobs/Cost Detail by Client
  25. Printed Jobs/Cost Detail by Client - Graph
  26. Printed Jobs/Cost Detail by Color
  27. Printed Jobs/Cost Detail by Color - Graph
  28. Printed Jobs/Cost Detail by Computer
  29. Printed Jobs/Cost Detail by Computer - Graph
  30. Printed Jobs/Cost Detail by Duplex
  31. Printed Jobs/Cost Detail by Duplex - Graph
  32. Printed Jobs/Cost Detail by Plotter
  33. Printed Jobs/Cost Detail by Plotter - Graph
  34. Printed Jobs/Cost Detail by Printer
  35. Printed Jobs/Cost Detail by Printer - Graph
  36. Printed Jobs/Cost Detail by User
  37. Printed Jobs/Cost Detail by User - Graph
  38. Printed Jobs/Cost Detail by User & Document
  39. Printed Jobs/Cost Detail by User & Paper Size
  40. Printed Jobs/Cost Detail by User & Plotter
  41. Printed Jobs/Cost Detail by User & Client
  42. Printed Jobs/Cost Summary by Client & User
  43. Deleted Jobs/Savings Summary by Date
  44. Deleted Jobs/Savings Summary by Date - Graph
  45. Deleted Jobs/Savings Summary by Group
  46. Deleted Jobs/Savings Summary by Group - Graph
  47. Deleted Jobs/Savings Summary by Plotter
  48. Deleted Jobs/Savings Summary by Plotter - Graph
  49. Deleted Jobs/Savings Summary by Printer
  50. Deleted Jobs/Savings Summary by Printer - Graph
  51. Deleted Jobs/Savings Summary by User
  52. Deleted Jobs/Savings Summary by User - Graph
  53. Deleted Jobs/Savings Detail by Color
  54. Deleted Jobs/Savings Detail by Color - Graph
  55. Deleted Jobs/Savings Detail by Computer
  56. Deleted Jobs/Savings Detail by Computer - Graph
  57. Deleted Jobs/Savings Detail by Duplex
  58. Deleted Jobs/Savings Detail by Duplex - Graph
  59. Deleted Jobs/Savings Detail by Plotter
  60. Deleted Jobs/Savings Detail by Plotter - Graph
  61. Deleted Jobs/Savings Detail by Printer
  62. Deleted Jobs/Savings Detail by Printer - Graph
  63. Deleted Jobs/Savings Detail by User
  64. Deleted Jobs/Savings Detail by User - Graph
  65. Customized Printed Jobs/Cost Summary by Computer
  66. Customized Printed Jobs/Cost Summary by Computer - Graph
  67. Customized Printed Jobs/Cost Summary by Plotter
  68. Customized Printed Jobs/Cost Summary by Plotter - Graph
  69. Customized Printed Jobs/Cost Summary by Printer
  70. Customized Printed Jobs/Cost Summary by Printer - Graph
  71. Customized Printed Jobs/Cost Summary by User
  72. Customized Printed Jobs/Cost Summary by User - Graph
  73. Customized Printed Jobs/Cost Detail by Color
  74. Customized Printed Jobs/Cost Detail by Color - Graph
  75. Customized Printed Jobs/Cost Detail by Computer
  76. Customized Printed Jobs/Cost Detail by Computer - Graph
  77. Customized Printed Jobs/Cost Detail by Duplex
  78. Customized Printed Jobs/Cost Detail by Duplex - Graph
  79. Customized Printed Jobs/Cost Detail by Plotter
  80. Customized Printed Jobs/Cost Detail by Plotter - Graph
  81. Customized Printed Jobs/Cost Detail by Printer
  82. Customized Printed Jobs/Cost Detail by Printer - Graph
  83. Customized Printed Jobs/Cost Detail by User
  84. Customized Printed Jobs/Cost Detail by User - Graph
  85. Customized Deleted Jobs/Savings Summary by Computer
  86. Customized Deleted Jobs/Savings Summary by Computer - Graph
  87. Customized Deleted Jobs/Savings Summary by Plotter
  88. Customized Deleted Jobs/Savings Summary by Printer
  89. Customized Deleted Jobs/Savings Summary by Printer - Graph
  90. Customized Deleted Jobs/Savings Summary by User
  91. Customized Deleted Jobs/Savings Summary by User - Graph
  92. Customized Deleted Jobs/Savings Detail by Color
  93. Customized Deleted Jobs/Savings Detail by Color - Graph
  94. Customized Deleted Jobs/Savings Detail by Computer
  95. Customized Deleted Jobs/Savings Detail by Computer - Graph
  96. Customized Deleted Jobs/Savings Detail by Plotter
  97. Customized Deleted Jobs/Savings Detail by Printer
  98. Customized Deleted Jobs/Savings Detail by Printer - Graph
  99. Customized Deleted Jobs/Savings Detail by User
  100. Customized Deleted Jobs/Savings Detail by User - Graph